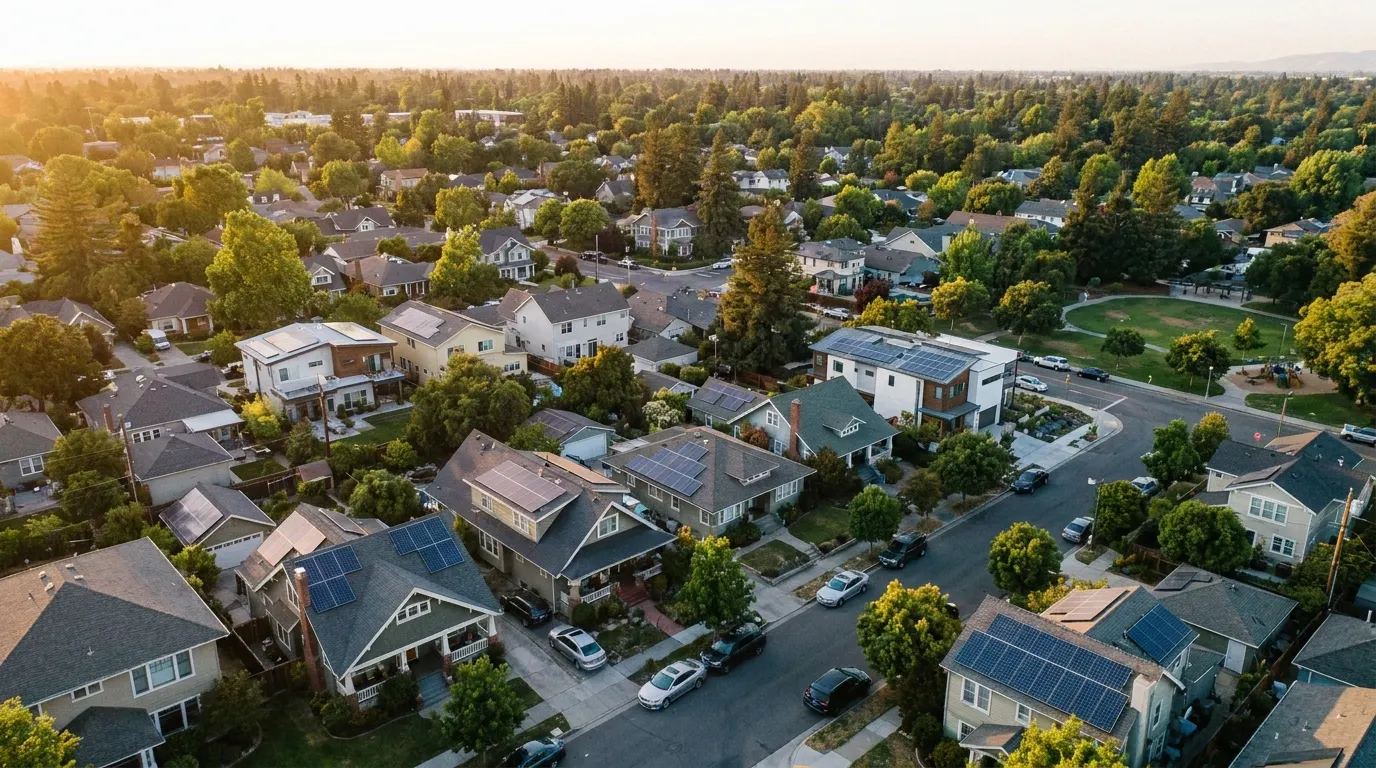
How common is rooftop solar where you live? Every month, utilities report to the U.S. Energy Information Administration how many of their residential customers have solar panels enrolled in net metering, the program that credits power sent back to the grid. Those reports (Form EIA-861M) are the most up-to-date public count of solar homes by state. This page uses the July 2026 figures.
The national picture
- About 5.64 million homes had rooftop solar enrolled in net metering or a similar program in July 2026.
- That is about 440,000 more homes than a year earlier, an increase of roughly 8.5%.
- Between them, those homes have about 41,500 megawatts of panels, an average of about 7.4 kW per home.
- Utilities reported about 4,900 MW of home batteries paired with solar, three-quarters of it in California.
California alone accounts for about 40% of all solar homes. Add Arizona, Florida, New York, New Jersey and Massachusetts and you have close to two-thirds of the country.
What share of homes have solar

The raw count favors big states. To see how common solar is, we divided each state’s net-metered solar homes by its residential electricity customers in the same month, which utilities also report to the EIA. Nationally, about 3.8% of homes have rooftop solar: 5.44 million of 143.8 million residential customers in the 50 states and Washington, D.C.
- Hawaii leads by far, with about one home in four (24.0%). California follows at 15.3%, then Nevada (10.7%) and Arizona (10.4%).
- Seven more are between 6% and 10%: Connecticut, Massachusetts, Colorado, Washington, D.C., Utah, New Mexico and Vermont. New Jersey is right at 6.0%.
- In 17 states, fewer than one home in 100 has solar on net metering, all of them in the Midwest and the South, including Texas (0.6%), Ohio and Michigan (0.6% each) and Georgia (0.3%).
Two things to keep in mind. Residential customers include apartments, where rooftop solar is rarely an option, so the share among single-family homes is higher than these figures. And only homes on net metering are counted, so states where many solar homes are on other arrangements, such as Tennessee, Texas and Alabama, look lower than they are. Puerto Rico isn’t in the EIA’s customer data, so it has no share.
Every state
| # | State | Homes with solar | Share of homes | Change in a year | Average system | Paired batteries |
|---|---|---|---|---|---|---|
| 1 | California | 2,272,639 | 15.3% | +7% | 6.3 kW | 3,784 MW |
| 2 | Arizona | 335,129 | 10.4% | +4% | 7.5 kW | 216 MW |
| 3 | Florida | 275,181 | 2.5% | +9%* | 11.1 kW | 33 MW |
| 4 | New York | 262,481 | 3.5% | +9% | 7.2 kW | 53 MW |
| 5 | New Jersey | 229,253 | 6.0% | +10% | 7.1 kW | 36 MW |
| 6 | Massachusetts | 214,085 | 7.0% | +7% | 7.2 kW | 32 MW |
| 7 | Puerto Rico | 202,291 | — | +21% | 7.4 kW | — |
| 8 | Colorado | 177,270 | 7.0% | +6% | 6.6 kW | 7 MW |
| 9 | Nevada (Las Vegas) | 145,581 | 10.7% | +5% | 7.9 kW | 41 MW |
| 10 | Connecticut | 123,769 | 7.7% | +11% | 7.8 kW | under 1 MW |
| 11 | Illinois | 123,606 | 2.3% | +16% | 9.2 kW | — |
| 12 | Maryland | 122,171 | 4.9% | +9% | 8.6 kW | 11 MW |
| 13 | Hawaii (Honolulu) | 108,289 | 24.0% | +7% | 5.8 kW | 340 MW |
| 14 | Pennsylvania (Philadelphia) | 101,201 | 1.8% | +24% | 8.3 kW | 15 MW |
| 15 | Utah | 84,627 | 6.6% | +4% | 6.3 kW | 101 MW |
| 16 | Texas | 81,647 | 0.6% | +3%* | 13.1 kW | 15 MW |
| 17 | Virginia | 72,495 | 1.9% | +16%* | 8.3 kW | 6 MW |
| 18 | Oregon | 61,434 | 3.2% | +12% | 7.0 kW | 28 MW |
| 19 | New Mexico | 61,392 | 6.6% | +3% | 5.8 kW | 5 MW |
| 20 | North Carolina | 59,308 | 1.1% | +8% | 8.3 kW | under 1 MW |
| 21 | Washington (Seattle) | 58,556 | 1.7% | +10%* | 8.7 kW | 40 MW |
| 22 | South Carolina | 35,994 | 1.3% | +2%* | 8.9 kW | 8 MW |
| 23 | Louisiana | 31,564 | 1.4% | +2%* | 6.6 kW | — |
| 24 | Ohio | 31,196 | 0.6% | +18% | 9.1 kW | 16 MW |
| 25 | Missouri (Kansas City) | 26,907 | 0.9% | +7%* | 13.7 kW | 8 MW |
| 26 | Michigan | 26,641 | 0.6% | +13% | 7.0 kW | 33 MW |
| 27 | New Hampshire | 25,963 | 3.9% | +8% | 8.5 kW | 9 MW |
| 28 | Minnesota | 23,862 | 0.9% | +14% | 10.3 kW | 1 MW |
| 29 | Idaho | 23,824 | 2.6% | +2% | 6.9 kW | 6 MW |
| 30 | Washington, D.C. | 22,340 | 6.8% | +16% | 6.7 kW | — |
| 31 | Rhode Island | 21,194 | 4.5% | +13% | 6.4 kW | 16 MW |
| 32 | Maine | 20,668 | 2.7% | +20% | 8.5 kW | 2 MW |
| 33 | Wisconsin | 19,488 | 0.7% | +14% | 8.8 kW | 10 MW |
| 34 | Vermont | 19,457 | 6.2% | +111%* | 8.0 kW | — |
| 35 | Iowa | 18,372 | 1.2% | +15% | 9.8 kW | — |
| 36 | Oklahoma | 16,335 | 0.8% | +6%* | 8.5 kW | 4 MW |
| 37 | Arkansas | 16,095 | 1.1% | +1%* | 11.3 kW | under 1 MW |
| 38 | Georgia | 15,216 | 0.3% | +10%* | 10.4 kW | — |
| 39 | Delaware | 14,806 | 3.1% | +5% | 8.1 kW | under 1 MW |
| 40 | Montana | 13,282 | 2.3% | +24% | 7.7 kW | 6 MW |
| 41 | Kansas | 9,490 | 0.7% | +12% | 9.1 kW | — |
| 42 | Indiana | 9,469 | 0.3% | +4%* | 11.4 kW | 2 MW |
| 43 | Kentucky | 8,092 | 0.4% | +6%* | 10.9 kW | 4 MW |
| 44 | West Virginia | 5,312 | 0.6% | +26% | 9.3 kW | 8 MW |
| 45 | Wyoming | 3,715 | 1.3% | +15% | 6.6 kW | 2 MW |
| 46 | Nebraska | 3,126 | 0.3% | +12%* | 9.1 kW | under 1 MW |
| 47 | Alaska | 3,100 | 1.0% | +11% | 5.5 kW | — |
| 48 | Mississippi | 1,812 | 0.1% | +4% | 6.2 kW | under 1 MW |
| 49 | South Dakota | 583 | 0.1% | +10%* | 6.7 kW | — |
| 50 | Tennessee | 101 | <0.1% | +9% | 6.9 kW | under 1 MW |
| 51 | North Dakota | 91 | <0.1% | +8% | 15.4 kW | — |
* The utility changed how it reports during the period, so the one-year change may reflect reporting rather than new installations. “Share of homes” is homes with solar divided by residential electricity customers. “Average system” is total residential capacity divided by the number of homes. “Paired batteries” is the capacity of home batteries installed with solar that utilities reported; a dash means none was reported, not necessarily that there are none.
Tennessee, Alabama and a few other states show very few or no net-metered homes because their main utilities don’t offer net metering: in the Tennessee Valley Authority’s territory, for example, solar homes are on other arrangements that this count doesn’t capture. For those states, the numbers above understate how many homes have solar. Alabama’s utilities reported no net-metered homes, so it isn’t in the table.
What stands out
Growth has moved away from the old leaders. California, Arizona, Nevada, Utah and New Mexico, the states where home solar took off first, grew by 7% or less in the year to July 2026. In California, new installations fell after the state cut what exported power earns, in April 2023. The fastest growth among large markets was in Pennsylvania (+24%), Ohio (+18%), Illinois (+16%), Minnesota (+14%) and Michigan (+13%), states where electricity rates have been rising and, in Illinois and Pennsylvania, where solar owners can sell renewable energy credits.
Puerto Rico is a solar story of its own. More than 200,000 homes on the island have net-metered solar, up 21% in a year and roughly ten times the number at the end of 2020, as homeowners looked for power that doesn’t depend on a grid that has struggled since Hurricane Maria. The utility doesn’t report battery capacity, so the island has no battery figure here.
Hawaii leads on batteries. Hawaii has 340 MW of home batteries paired with solar for about 108,000 solar homes, more than 3 kW per home, the highest ratio in the country. Hawaii stopped offering traditional net metering to new customers years ago, so storing solar for the evening is where its value is. California follows with about 1.7 kW of batteries per solar home.
System sizes follow the climate and the rate structure. Homes in hot states with high air-conditioning loads and cheaper electricity, such as Florida, Texas and Missouri, have the largest systems, above 11 kW on average. Homes in Hawaii, New Mexico and Alaska have the smallest, under 6 kW.
Where solar homes have batteries
Battery capacity paired with home solar, per solar home, in states with at least 20,000 solar homes:
| State | Paired battery capacity | Per solar home |
|---|---|---|
| Hawaii | 340 MW | 3.1 kW |
| California | 3,784 MW | 1.7 kW |
| Michigan | 33 MW | 1.2 kW |
| Utah | 101 MW | 1.2 kW |
| Rhode Island | 16 MW | 0.7 kW |
| Washington | 40 MW | 0.7 kW |
| Arizona | 216 MW | 0.6 kW |
| Ohio | 16 MW | 0.5 kW |
| Oregon | 28 MW | 0.5 kW |
A typical home battery delivers around 5 to 11.5 kW, and some homes have two, so these ratios can’t be turned into an exact count of homes with batteries. Batteries follow the rules for exported power: where exports earn little, as in Hawaii and under California’s net billing tariff, storing solar for the evening is worth more. Utah stands out among smaller markets, in part because its largest utility, Rocky Mountain Power, pays homeowners to let it draw on their batteries during peak demand. For the costs and the payback, see whether solar batteries are worth it.
If you are thinking about going solar
A state’s number of solar homes tells you how established the local market is, but not whether solar pays off for you. What matters most:
- Your electricity rate. At 30 cents per kWh or more, as in California, Massachusetts or New York, a typical system can pay for itself in under 15 years even without the federal credit. At 13 to 16 cents, as in much of the South and Mountain West, it takes much longer.
- How your utility pays for exports. Full retail credit, a lower export rate, or nothing at all can change the savings by thousands of dollars.
- The price you pay. The median home system cost $4.25 per watt in 2025, but prices vary more between installers in the same city than between states.
Our solar cost guide walks through the math for several cities, and each state page links to the installer rankings where public records name the installers.
What these numbers don’t tell you
- Homes, not installations per year. The count is a running total of homes enrolled; it grows by new installations minus systems removed or moved to other arrangements.
- Only homes in net metering or a similar program. Homes whose utility offers something else, or none, are not all counted. That affects Tennessee and Alabama most, and to a lesser degree Texas, where many homes buy power from retail providers.
- Reporting changes. When a utility changes how it reports, the count can jump. We mark those states with an asterisk.
For the installers behind these numbers, see our city rankings, built from installation records that name the company. For what a system costs and how long it takes to pay back in different states, see our solar cost guide.
Source
U.S. Energy Information Administration, Form EIA-861M (monthly electric power industry report), net metering, residential photovoltaic customers and capacity, July 2026 (preliminary) and July 2025. Puerto Rico from the territories table. Residential electricity customers from the same form’s sales and revenue data, July 2026. Calculations by Solar Power Fix.
Frequently Asked Questions
How many homes in the U.S. have solar panels?
Utilities reported about 5.64 million homes with rooftop solar enrolled in net metering or a similar export program in July 2026, according to the Energy Information Administration's Form EIA-861M, up about 8.5% from a year earlier. Homes on other arrangements are not all counted, so the real number is somewhat higher.
What percentage of U.S. homes have solar panels?
About 3.8%. In July 2026, 5.44 million homes had rooftop solar on net metering, out of 143.8 million residential electricity customers in the 50 states and Washington, D.C., according to the EIA. Hawaii has the highest share (24.0%), followed by California (15.3%), Nevada (10.7%) and Arizona (10.4%). The customer count includes apartments, so the share among single-family homes is higher.
Which state has the most homes with solar?
California, by far: about 2.27 million homes, around 40% of the national total. Arizona, Florida, New York and New Jersey follow, each with between 229,000 and 336,000 homes.
Which states are adding solar homes the fastest?
Among states with at least 20,000 solar homes and consistent reporting, Pennsylvania grew fastest in the year to July 2026 (+24%), followed by Puerto Rico (+21%), Maine (+20%), Ohio (+18%) and Illinois (+16%).
How big is the average home solar system?
Across all net-metered homes, the average is about 7.4 kW: 41,500 MW of panels on 5.64 million homes. It ranges from under 6 kW in Hawaii, New Mexico and Alaska to more than 11 kW in Florida, Missouri and Texas.